SDOH Example
This is the SDOH example page.
Mapping the SDoH
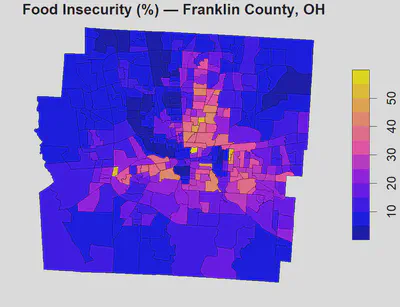
Goal: Build a tract-level map of food insecurity and housing insecurity in Franklin County, Ohio using the CDC PLACES dataset, then export an sf/GeoJSON layer for reuse on the ISSUES Lab site.
Pipeline overview
- Query PLACES (Socrata API) for two indicators filtered to Franklin County via FIPS.
- Coerce indicators to numeric.
- Download census tract polygons (TIGER/Line via tigris) and left_join on tract GEOID.
- Mean-impute missing values for food insecurity (for quick visualization only).
- Plot a fast choropleth and write a GeoJSON file.
ℹ️ The PLACES “GIS-friendly” table is attributes only. Socrata “location” endpoints typically expose centroids, not tract polygons—so we fetch attributes and join to TIGER/Line shapes.
Requirements (install once)
install.packages(c("RSocrata", "dplyr", "tigris", "sf"))

## Requirements (install once)

```r
install.packages(c("RSocrata", "dplyr", "tigris", "sf"))

## Load each session

- **RSocrata** — read data from data.cdc.gov (Socrata)
- **dplyr** — data manipulation
- **tigris** — tract geometries (TIGER/Line)
- **sf** — spatial classes, I/O (GeoJSON)
- **utils** — base R utilities

### Optional nicety

    options(tigris_use_cache = TRUE)  # cache shapefiles locally between runs

#########################################
# Downloading PLACES data to            #
# map the social determinants of health #
# for food and housing insecurity for   #
# the ISSUES lab next paper :)          #
# September 9, 2025                     #
# Example                               #
#########################################

# install.packages("RSocrata") etc once
library(RSocrata) # read online data
library(dplyr)    # manipulate dataframes
library(utils)    # utilities

base <- "https://data.cdc.gov/resource/yjkw-uj5s.json"

# Note there is a geojson endpoint however the geometry is the centroid
# so it's better to download the non-spatial data and then get the census tract,
# and then merge the data to the census tract polygons.
fields <- c(
  "stateabbr","countyname","countyfips","tractfips",
  "foodinsecu_crudeprev","housinsecu_crudeprev"
)

select_q <- paste(fields, collapse = ",")

# Filter to Franklin County, Ohio (prefer FIPS for precision)
where_q <- "stateabbr = 'OH' AND countyfips = '39049'"

(url <- paste0(
  base, "?$select=", select_q,
  "&$where=", URLencode(where_q, reserved = TRUE)
))

df_franklin <- read.socrata(url) %>%
  mutate(
    foodinsecu_crudeprev = as.numeric(foodinsecu_crudeprev),
    housinsecu_crudeprev = as.numeric(housinsecu_crudeprev)
  )

glimpse(df_franklin)

library(tigris) # connect to census mapping files
options(tigris_use_cache = TRUE)

# We have census tract level data for Ohio (state FIPS = 39),
# Franklin County (county FIPS = 049). Using 2022 TIGER (2020 vintage).
oh_ct <- tracts(state = "Ohio", county = "Franklin", year = 2022, class = "sf")

df_franklin <- df_franklin %>% dplyr::rename(GEOID = tractfips)
oh_ct <- oh_ct %>% dplyr::left_join(df_franklin, by = "GEOID")

# Quick map (before imputation)
plot(oh_ct["foodinsecu_crudeprev"], main = "Food Insecurity (%) — Franklin County, OH")

# Mean-impute missing (visualization only)
m_food <- mean(oh_ct$foodinsecu_crudeprev, na.rm = TRUE)
oh_ct$foodinsecu_crudeprev[is.na(oh_ct$foodinsecu_crudeprev)] <- m_food

# Plot (after imputation)
plot(oh_ct["foodinsecu_crudeprev"], main = "Food Insecurity (%) — Franklin County, OH")

library(sf)
st_write(
  oh_ct,
  "C:/Users/barboza-salerno.1/Documents/lab/content/resources/datasets/ohio-franklin-sdoh.geojson",
  delete_dsn = TRUE
)
Tips & adaptations
- Change geography: Edit
where_qto your targetstateabbrandcountyfips(or drop the filter for entire states/US). - More indicators: Add PLACES columns to
fields(e.g.,lacktrpt_crudeprev,emotionspt_crudeprev). - Prettier maps: Use
ggplot2 + geom_sf()withscale_fill_viridis_c()for publication graphics. - Missing data: Mean-imputation here is for a quick map; use a different imputation method.
- Export path: Update
st_write()to download the geojson file to your hard drive and map it with QGIS.
Downloads
- R script is here: Download the R script
- Mapping file is here: Download the geojson file for mapping

Dr. Gia Elise Barboza-Salerno
Director
I am an interdisciplinary scholar whose research integrates law, public health, social work, and advanced statistics to study childhood adversity, violence-related harm, and neighborhood-level inequities. I lead the ISSUES Lab at Ohio State, translating spatial and legal analysis into policy and practice.